Silica Sand Pricing Factors: What Determines Cost Per Ton

Introduction: Understanding Silica Sand Pricing in the Global Market
Silica sand is one of the most critical raw materials in modern industrial manufacturing, yet its pricing remains one of the least understood aspects of the commodities market. Whether you're sourcing material for glass production, ceramics manufacturing, or foundry operations, understanding silica sand pricing factors is essential for optimizing your procurement strategy and maintaining competitive margins.
The cost per ton of silica sand varies significantly based on numerous interconnected variables. Unlike standardized commodities with fixed pricing, silica sand costs fluctuate based on quality specifications, geographic sourcing, processing requirements, and market conditions. For B2B buyers navigating this landscape, knowledge is the most valuable asset.
This comprehensive guide explores the primary factors that determine silica sand pricing, providing actionable insights for industrial procurement professionals, manufacturing executives, and trading companies seeking to make informed purchasing decisions.
The Foundation: Raw Material Quality and Purity Grades
SiO2 Content and Classification
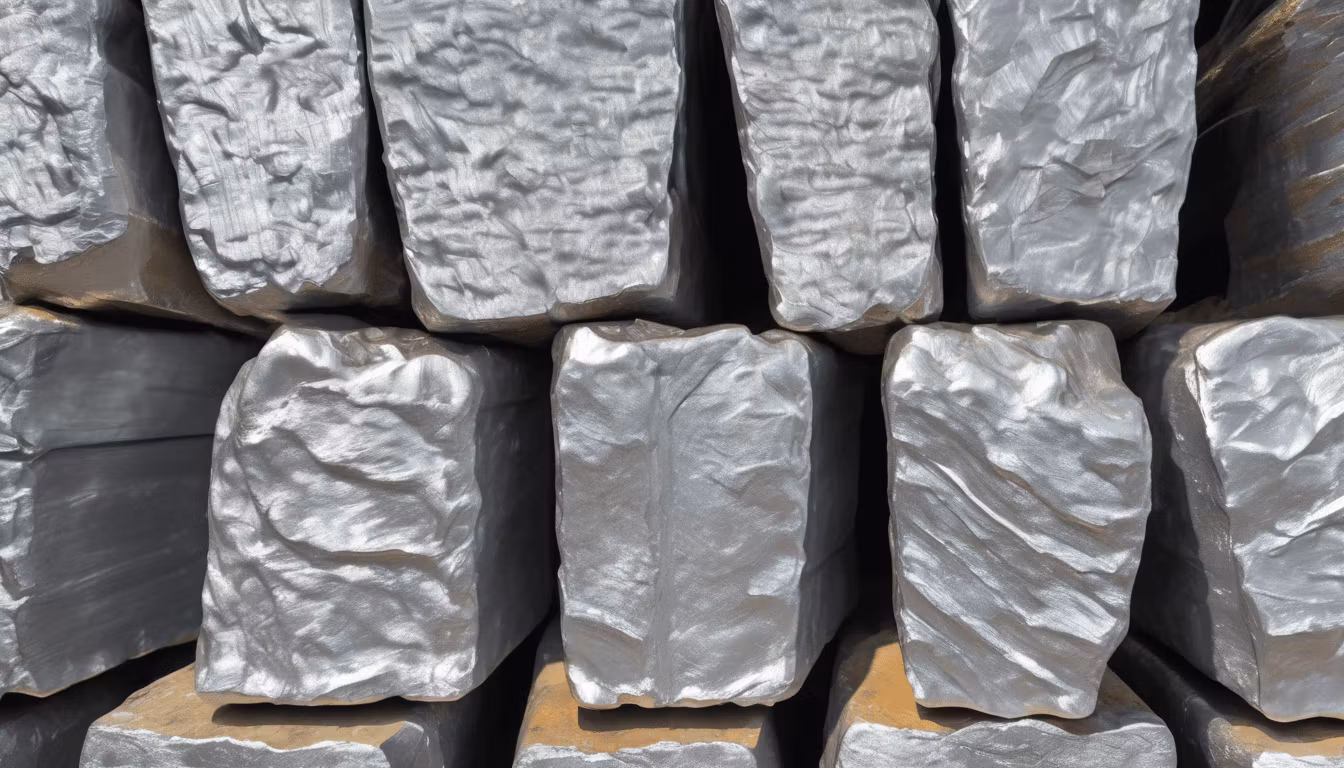
The most fundamental pricing driver for silica sand is silicon dioxide (SiO2) content. Industrial-grade silica sand typically ranges from 95% to 99.8% SiO2 purity, with prices scaling directly with purity levels. Material with 99.74% SiO2 content—the specification we maintain at CV Indoalam Mineral Persada—commands premium pricing compared to lower-grade alternatives.
Here's why purity matters for your bottom line:
- Glass Manufacturing: Float glass and solar panel production require 99%+ SiO2 to minimize defects and maintain optical clarity. Even 0.5% impurity variance can necessitate additional processing, increasing your total material cost.
- High-Tech Applications: Electronics-grade silica demands 99.9%+ purity, commanding prices 3-5 times higher than construction-grade material.
- Foundry Operations: Core sand applications typically accept 98-99% SiO2, offering cost savings while maintaining performance specifications.
Iron Oxide and Impurity Profiles
Iron oxide (Fe2O3) content is the second most critical quality metric. Higher iron content reduces price because it:
- Discolors glass, requiring additional refining steps
- Weakens ceramic and refractory materials
- Compromises water treatment effectiveness
- Creates oxidation issues in metal casting applications
Premium-grade material maintains Fe2O3 below 0.05%, while industrial-grade typically ranges from 0.1-0.3%. This seemingly small difference translates to 10-15% price variation per ton in current market conditions.
Mesh Grade and Size Distribution: A Critical Pricing Variable
Understanding Mesh Specifications
Silica sand pricing varies considerably based on particle size distribution, measured in mesh grades ranging from 8 mesh to 200 mesh. Different applications demand different specifications:
- Coarse Grades (8-30 mesh): Used in foundry cores, water filtration, and concrete aggregates. Most cost-effective option.
- Medium Grades (40-100 mesh): Standard for ceramic tile production, sandblasting, and industrial abrasives. Mid-range pricing.
- Fine Grades (120-200 mesh): Required for glass manufacturing, electronic applications, and precision coatings. Premium pricing.
Processing and Sieve Cost Impact
Achieving precise size distribution requires specialized screening and classification equipment. Finer grades demand more stringent processing controls, increasing operational costs by 15-30%. This expense is directly passed to end-users through higher per-ton pricing.
A 200-mesh material might cost 40-50% more than equivalent-quality 40-mesh material, despite identical SiO2 content, purely due to processing requirements.
Geographic Sourcing and Production Costs
Mining Location Premium
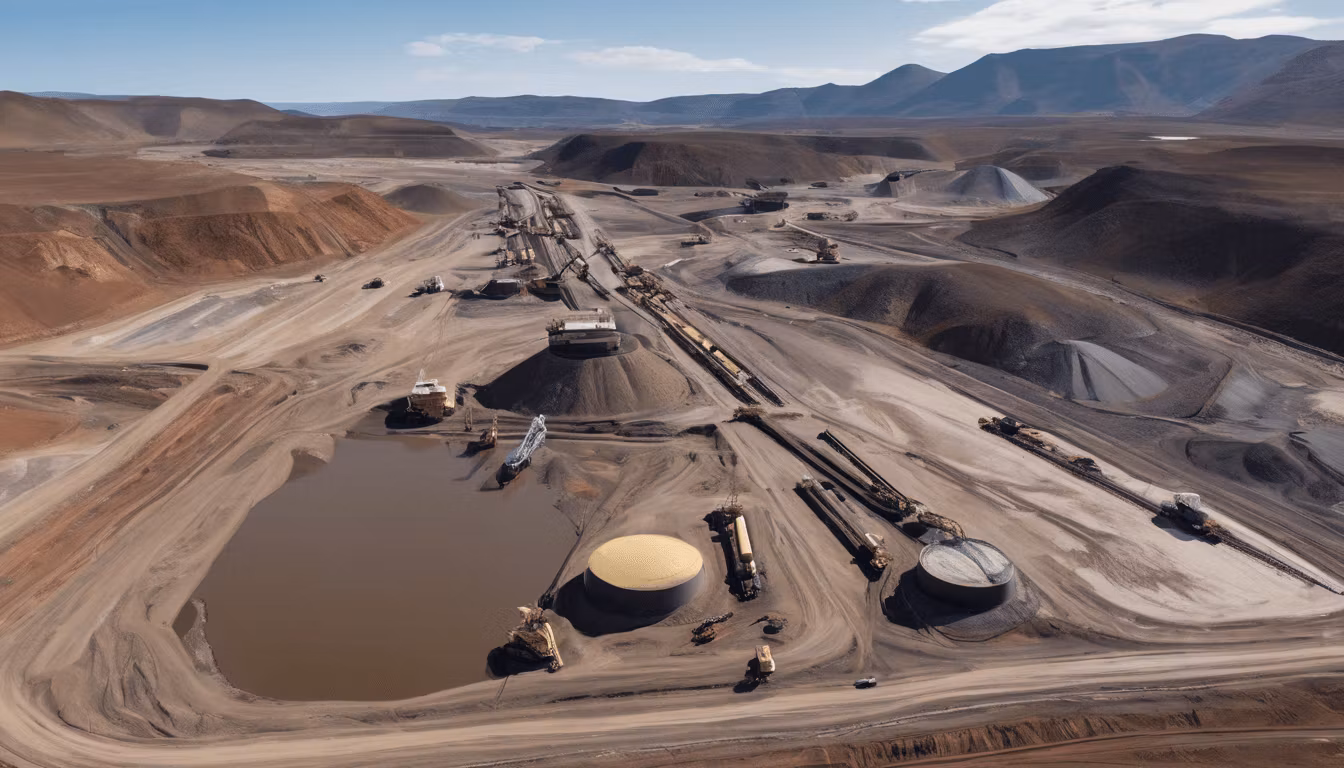
The geographic origin of silica sand significantly impacts its final cost. CV Indoalam sources material from optimal regions in Sulawesi, Kalimantan, and Maluku, where naturally high-quality deposits reduce processing costs by 20-30% compared to sourcing from inferior deposits requiring extensive beneficiation.
Key sourcing considerations include:
- Deposit Quality: Naturally occurring high-purity deposits (like those in Morowali, Sulawesi) require minimal processing, reducing costs
- Extraction Depth: Surface mining is cheaper than deep extraction; sub-surface deposits increase operational expenses
- Regional Infrastructure: Developed mining regions have established transportation networks, reducing logistics costs by 10-15%
Labor and Regulatory Compliance Costs
Indonesian mining operations benefit from competitive labor costs compared to developed markets, translating to 20-30% lower processing expenses. However, full compliance with IUP OPK licensing requirements, SUCOFINDO testing protocols, and RKAB environmental standards adds 5-8% to production costs—a necessary investment ensuring buyer confidence and regulatory compliance.
Processing, Testing, and Quality Assurance Expenses
Laboratory Testing and Certification
SUCOFINDO-certified laboratory testing adds measurable costs to silica sand but provides irreplaceable value for B2B buyers. Complete testing protocols include:
- SiO2 content analysis (XRF spectroscopy)
- Iron oxide determination
- Particle size distribution assessment
- Moisture content verification
- Heavy metal screening
- Trace element analysis
Comprehensive certification typically adds $2-5 per ton to material costs but eliminates buyer risk and enables premium pricing in international markets.
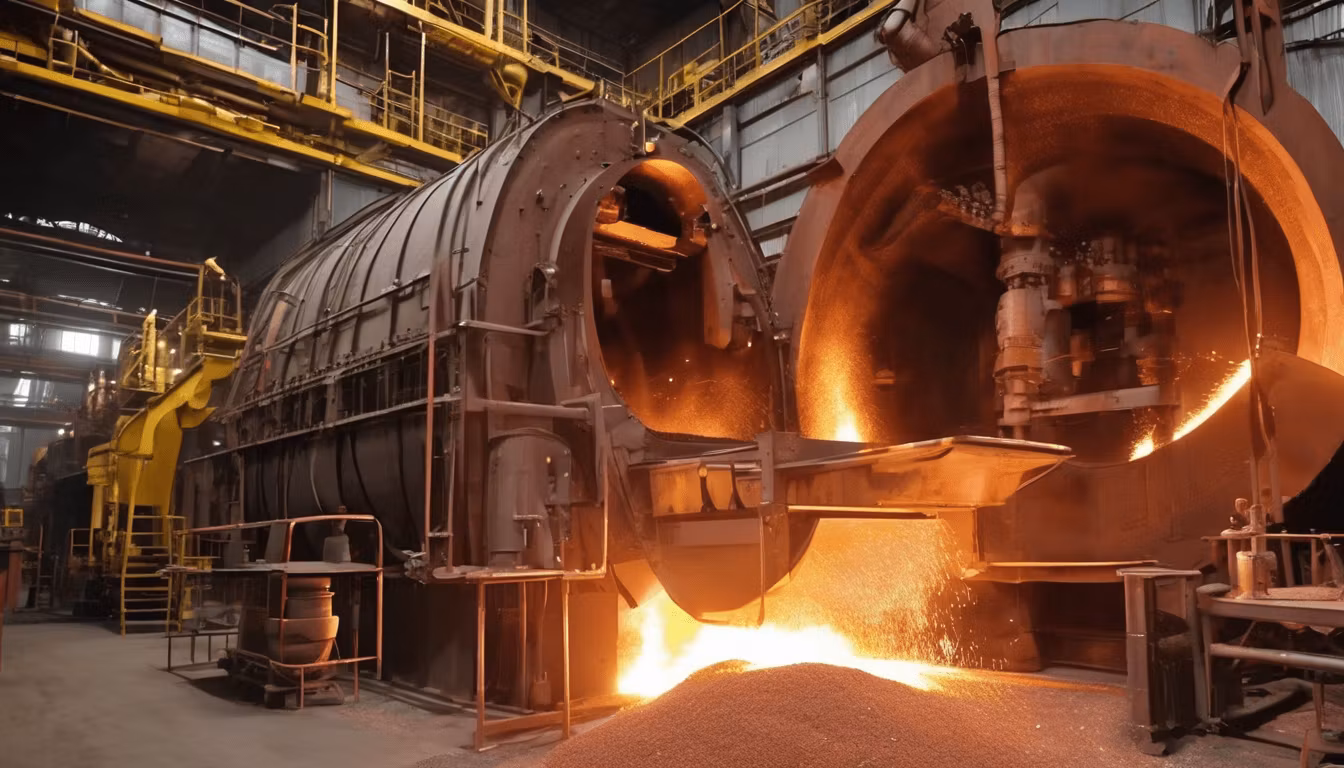
Washing, Drying, and Processing
Raw silica sand requires extensive processing before reaching end-user specifications. Processing steps include:
- Washing: Removes clay and fine particles (adds $3-7/ton)
- Drying: Reduces moisture to specification levels (adds $2-4/ton)
- Screening: Achieves precise size distribution (adds $4-8/ton for fine grades)
- Dust Control: Environmental compliance and product quality (adds $1-3/ton)
Premium-grade material destined for glass manufacturing or electronics applications undergoes additional purification steps, potentially doubling processing costs compared to industrial-grade material.
Supply Chain Logistics and Transportation Factors
Bulk Handling and Port Operations
Transportation represents 20-40% of total silica sand cost per ton, making logistics optimization critical. Key considerations include:
- Mine to Port Distance: Longer hauls increase trucking costs; short distances to major ports (like those in Sulawesi) reduce expenses
- Port Infrastructure: Modern bulk handling facilities reduce loading times and costs
- Vessel Selection: Larger bulk carriers achieve economies of scale; smaller shipments incur premium freight rates
Packaging and Storage Considerations
Silica sand delivery format impacts pricing:
- Bulk Shipment (1,000+ MT): Lowest per-ton cost; minimal packaging
- Bagged Material (20-25kg bags): 30-50% premium for labor, bags, and handling
- Intermediate Bulk Containers (IBC): 15-25% premium for containment and reusability
International export logistics add complexity. FoB (Free on Board) pricing differs significantly from CIF (Cost, Insurance, Freight) pricing, with international shipping potentially adding $40-80 per ton depending on destination markets.
Market Dynamics and Global Commodity Trends
Seasonal Demand Fluctuations
Silica sand pricing exhibits seasonal patterns driven by downstream industry cycles:
- Q1-Q2: Construction and glass manufacturing ramp up; prices typically 5-10% higher
- Q3-Q4: Demand softens; prices decline 3-7% as buyers delay purchases
- Weather Events: Monsoon seasons in Indonesia can disrupt mining and shipping, temporarily increasing prices 5-15%
Global Supply and Demand Imbalances
International silica sand pricing correlates with:
- Construction Activity: Global construction indices influence glass and ceramics demand
- Solar Panel Production: Renewable energy expansion drives glass silica demand
- Electronic Component Manufacturing: Semiconductor and electronics production impacts high-purity material demand
- Currency Fluctuations: USD strength affects export competitiveness and pricing for international buyers
Benchmark Pricing and Index Systems
The silica sand market lacks a centralized pricing index like crude oil or metals futures markets. However, pricing typically references:
- Regional producer quotes (adjusted monthly)
- Published industry indices from commodities research firms
- Previous transaction benchmarks
- Quality and specification adjustments applied to base prices
Contract Volume and Procurement Strategy Impact
Economies of Scale in Silica Sand Purchasing
Purchase volume directly influences per-ton pricing:
- Trial Orders (100-500 MT): Baseline pricing; small volume premium
- Regular Orders (1,000-5,000 MT): 5-8% volume discount
- Annual Contracts (50,000+ MT): 10-15% volume discount; potential supply security premium
This pricing structure reflects supplier operational costs and cash flow optimization. Larger commitments enable suppliers to optimize production scheduling and reduce per-unit overhead.
Contract Terms and Payment Structures
Purchasing terms influence effective pricing:
- Spot Purchases: Highest per-ton cost; immediate payment required
- 30-Day Terms: 2-3% discount for improved supplier cash flow
- Quarterly Contracts: 3-5% discount for demand visibility
- Annual Supply Agreements: 5-8% discount plus price stability guarantees
Quality Assurance and Supplier Reliability Premium
The Hidden Cost of Unreliable Supply
Purchasing silica sand from certified, reliable suppliers like CV Indoalam—with full IUP OPK licensing, SUCOFINDO testing, and RKAB approval—carries an implicit premium compared to unverified sources. However, this premium protects against:
- Production Shutdowns: Material non-conformance can halt manufacturing operations, costing far more than material savings
- Quality Rework: Inferior material requiring additional processing reduces margins
- Regulatory Risk: Non-compliant sourcing exposes buyers to supply chain liability
- Reputational Damage: Supply chain issues cascade to end customers and brand reputation
Supplier Consistency and Long-Term Value
Established suppliers delivering consistent specifications reduce buyer procurement risk and operational overhead. The 3-8% premium for certified, tested material from licensed suppliers typically provides 15-25% total cost savings through reduced quality management, rework, and inventory management expenses.
Industry-Specific Pricing Considerations
Glass Manufacturing Requirements
Float glass and specialty glass producers demand 99%+ SiO2 with minimal iron oxide (typically <0.05%). This purity premium commands 20-30% higher prices than industrial-grade material, reflecting both material selection and processing intensity.
Ceramics and Tile Production
Ceramic manufacturers typically utilize 98-99% SiO2 material in medium mesh grades (60-120). Pricing in this segment remains relatively stable, with quality consistency being the primary value driver rather than extreme purity specifications.
Foundry and Metal Casting Applications
Foundries purchasing core sand and molding sand accept broader specifications (96-98% SiO2) and coarser mesh grades. This flexibility enables the most competitive pricing segment, with bulk contracts commonly achieving 15-20% discounts from baseline rates.
Negotiating Better Silica Sand Pricing: Strategic Recommendations
Building Supplier Relationships for Price Advantages
- Commit to Volume: Demonstrate purchasing consistency to unlock volume discounts
- Align Specifications: Use exactly what you need rather than over-specifying; premium grades cost more
- Plan Seasonally: Purchase during low-demand periods (Q3-Q4) for better pricing
- Direct Sourcing: Work with suppliers mining and processing material directly, eliminating middleman markups
Specification Optimization
Review whether your actual applications require premium-grade material. Many manufacturers over-specify, purchasing 99%+ SiO2 when 98.5% performs identically. Slight specification relaxation while maintaining performance can reduce costs 5-15% per ton.
Conclusion: Making Informed Silica Sand Purchasing Decisions
Silica sand pricing reflects a complex interplay of quality factors, processing requirements, logistics costs, market conditions, and supplier reliability. Understanding these variables enables B2B buyers to negotiate effectively, optimize specifications, and make strategic purchasing decisions aligned with operational and financial objectives.
The most competitive pricing emerges from working with established, certified suppliers offering:
- Direct mine sourcing eliminating middlemen markups
- SUCOFINDO-certified quality assurance
- Flexible supply from 100 MT trial orders to 2.5 million MT annual contracts
- Transparent pricing based on verifiable quality metrics
- Long-term supply relationships with price stability
CV Indoalam Mineral Persada specializes in premium quartz sand meeting these exact criteria, offering 99.74% SiO2 material across multiple mesh grades from both regional and international sources. With complete IUP OPK licensing, SUCOFINDO testing protocols, and RKAB environmental approval, we provide the transparency and reliability that justifies confident, long-term sourcing relationships.
Whether you're sourcing for glass manufacturing, ceramics production, foundry operations, or water treatment applications, understanding your actual specification requirements and working with direct-source suppliers delivers measurable cost advantages and supply chain security. Contact us today to discuss your specific silica sand requirements and discover how direct sourcing can optimize your procurement costs.